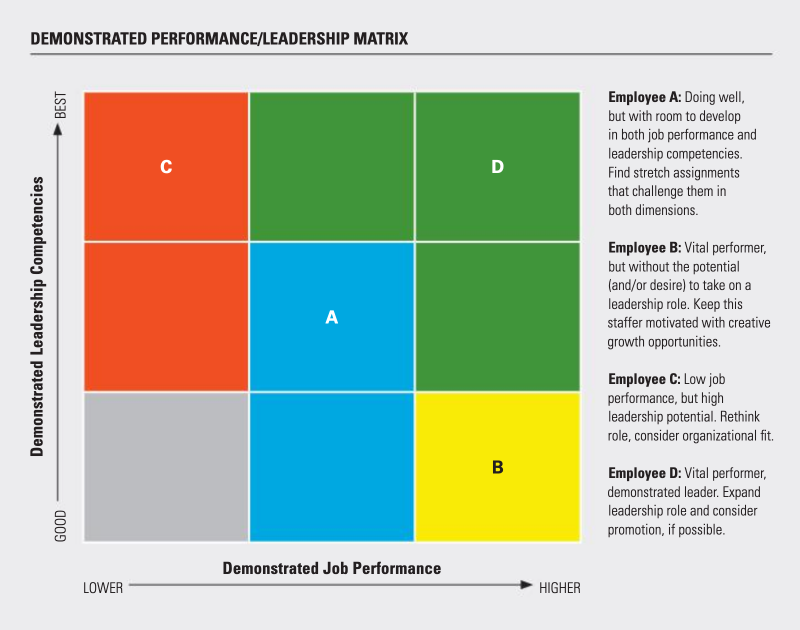
The Performance-Leadership Matrix, pictured below, was developed by The Bridgespan Group to analyze individual leadership potential and organization-wide staff needs, especially in terms of professional development.
You can find our full explanation beneath the illustration, or download Bridgespan’s instructions and templates in PDF form.

The Matrix is used by plotting every individual according to two factors:
The operative word here is demonstrated – that is, how that person has actually performed, as opposed to how you think they could be performing.
Job performance should be based on how well the individual has fulfilled their assigned role. Leadership competencies, on the other hand, must be defined according to organizational values: What are the qualities that best indicate potential for taking a leadership position in your organization? Some possible examples: commitment, honesty, positivity, responsiveness, creativity, vision, intuition, empathy, confidence, team-building, or risk-taking.
Once an individual is plotted on the Matrix, you can better see how to move them up the leadership axis. With the entire team plotted in a single graph, you can see how organizational performance and leadership are trending overall.
An overview of the common Matrix positions:
Note that most of your people will likely land in the middle (A) and the bottom-right (B).
Properly plotted, the Matrix enables you to identify challenges and develop goals for each individual, prepare talent for leadership positions that will open up in the future, and see where you might be able to deploy common solutions (like training through Nonprofit University) for a group of similarly-positioned people.
Learn more about how to make professional development happen here. For custom solutions regarding your strategy, team, and growth, check out GCN’s Nonprofit Consulting Group.
Check out the Nonprofit University course catalog, or view upcoming events.
Find it on Work for Good, the national nonprofit job board hosted by GCN.